 |
 |
 |
|
|
|
|
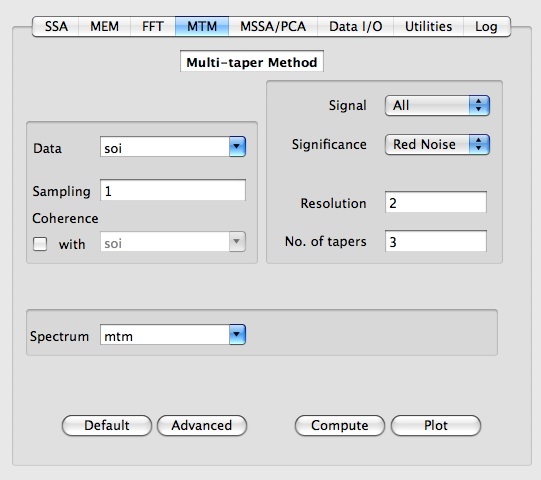
Having selected the data vector to be analyzed (here our 'soi' vector with the SOI time series) and the value of a sampling interval, a Default button is provided as a guide to set the rest of MTM parameters. By selecting the Coherence check box, user can choose another vector to compute MTM coherence with the Data vector. Both vectors should have the same length.
Results of MTM analysis, i.e. harmonic F-test, Spectrum or Coherence, are stored in a matrix with a name specified in Spectrum field. In addition, related MTM confidence levels (F-test, Spectrum or Coherence) are stored in a matrix with the name obtained by prefixing "conf_" to a Spectrum name, and can be accessed in Data I/O tool. If results from several MTM calculations have been stored in different matrices, the parameters used in a particular MTM analysis will be restored in GUI by simply selecting correspondent matrix from a Spectrum pop-up list.
Option ``All'' indicates that MTM spectrum will be tested both for the presence of narrowband signals, whose significance is measured by their amplitude relative to the estimated noise background, and for the presence of ``harmonic'' signals, which are significant as measured by the Thomson variance ratio test for periodic signals (F-test). Spectral peaks that pass both tests simultenously will form the Reshaped spectrum (see below Advanced settings), and together with the Raw MTM spectral estimate are stored as results. Also, the frequencies of highly significant narrowband signals will be shown in MTM components table, that can be selected for subsequent Reconstruction.
Option``Harmonic'' will test the spectrum only for the presence of periodic signals, and the results of F-test and its confidence levels are stored as MTM results. MTM components table will contain frequencies of highly significant F-test signals that can be selected for subsequent Reconstruction.
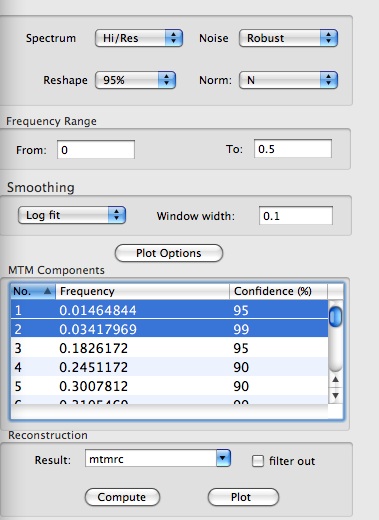
Here user can change various settings from their defaults, control MTM Plot Options, as well as reconstructing signal at selected significant frequencies.
Here the user can change threshold for significance of harmonic peak detection (F-test , 90%,95%,99%,99.5% and 99.9%) used in the ``Reshaping'' procedure.
The `Frequency Range' settings:
In addition ``Misfit Criterion''
can be set to either a log fit or a linear fit:
This table will contain list of the frequencies of highly significant signals (greater than the 90% level ) either from MTM spectrum, MTM harmonic test or MTM coherence, which can be selected for subsequent MTM reconstruction.
If Signal option is set to All or Narrowband , the Components table will contain a list of the central frequencies of narrowband signals (with their significance) in the MTM spectral estimate, identified as significant relative to the specified null hypothesis. For the Harmonic option of Signal it will contain the ``harmonic'' signals which are significant as measured by MTM Harmonic test (F-test) for periodic signals.
A maximum of the 200 most significant signals are stored.
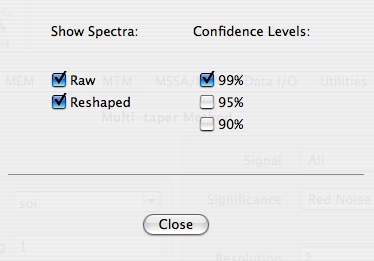
Plot Options:
User can choose to plot different types of spectra, as well as confidence levels (spectral, F-test or coherence) by pressing on Plot Options button of Advanced options window:
To calculate the power spectrum of our SOI series, we set the parameter for the ``Reshape'' to 90%,
and click the Compute button.
Then, we click the Plot button to view the spectrum which should look like the following:
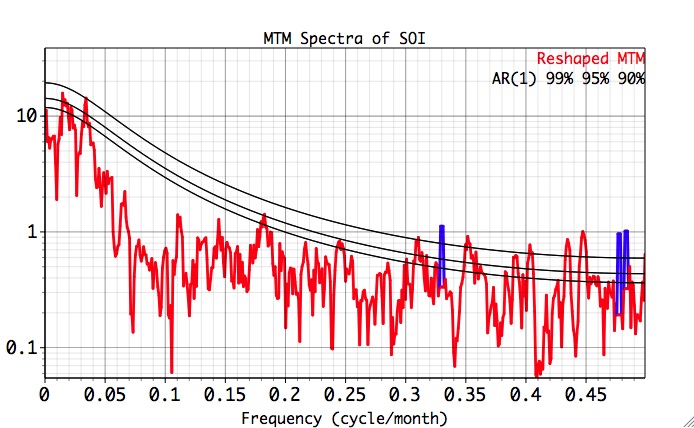
The above figure shows estimated continuous MTM spectrum or ``reshaped spectrum'' (the spectrum with estimated contributions of harmonic signals removed). Also, three additional smooth curves are shown, in increasing vertical progression, for the 90%, 95%, and 99% significance levels relative to the estimated noise background. Finally, the estimated harmonic or periodic component of the spectrum can be also displayed, i.e. the plot shows the estimated continuous spectrum, along with a curve that rises above it to indicate the portion of the spectrum above the continuous background associated with a period signal. The latter component is shown as a narrow spike of breadth equal to the spectral estimation bandwidth.
As we can see from the MTM Components table:
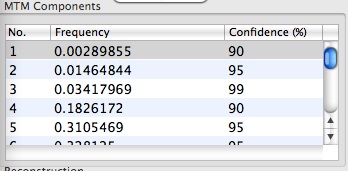
the MTM analysis identifies two highly significant peaks, one centered at f=0.0146, and another centered at f=0.0342. We associate these peaks with the low-frequency LF(band) and high frequency (HF) band ENSO signals. The blue peaks indicate harmonic signals selected in the Reshaping procedure.
Results of F-test for harmonic signals can be stored and plotted by performing MTM analysis with Harmonic option chosen in Signal settings:
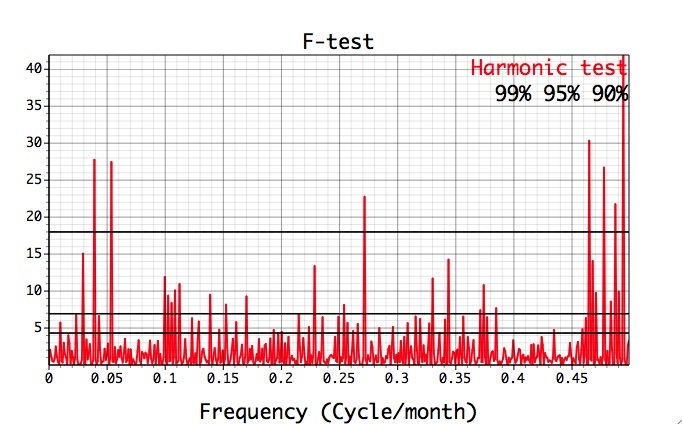
The list of F-test significant frequencies in the MTM Components table differs significantly from the narrowband signals:
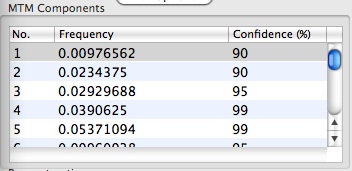
which explains why no peaks have been reshaped in ENSO frequency band, and is another manifestation of the quasi-periodic nature of ENSO.
(Note: In a demo version, MTM Reconstruction is available only for data of example projects! For custom data this feature is enabled after activation with a purchased Serial No.)
The Components table on the MTM Advanced options panel allows the reconstruction of the original time series from selected frequencies by clicking the 'Compute' button in Reconstruction. The ``Plot'' button plots the sum of the reconstructed components against the original time series. The name of vector with reconstruction is specified by the user in Result field of Reconstruction box. Individual RC components are stored in matrix with name obtained by prefixing "mat_" to Result name, and can be accessed in Data I/O tool. If results from several reconstructions have been stored in different vectors, the parameters for a particular reconstruction will be restored in GUI by simply selecting correspondent vector from a Result pop-up list. Checking "fliter out" box will filter out the selected components from the original data; this option is quite useful for detrending.
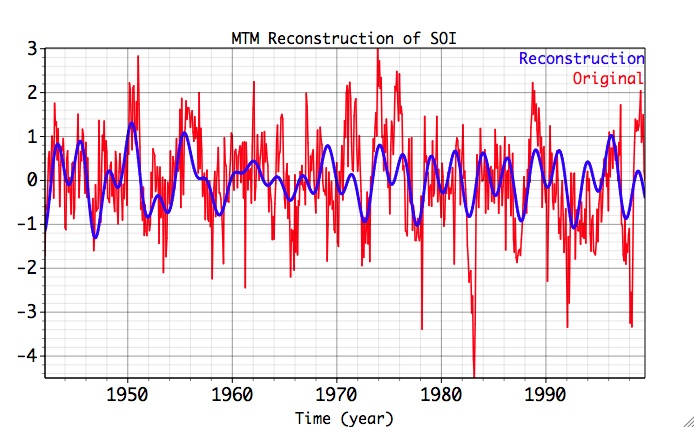
After selecting significant MTM spectral frequencies, clicking the Compute and Plot buttons in Reconstruction box, and adjusting the plot settings in Graph Controls), we obtain the following MTM-filtered series:
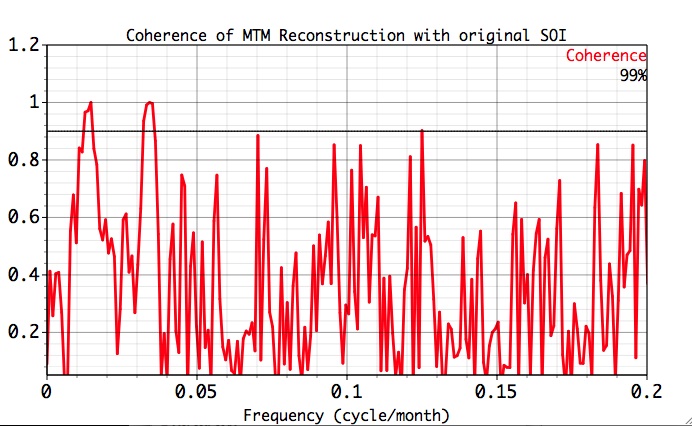
By selecting the Coherence check box, user can choose a 2nd vector to compute MTM coherence with the Data vector, and store it in MTM results. Both vectors should have the same length, and the coherence will be computed with the specified number of tapers, resolution, and other relevant settings. Below are shown Coherence estimates of original SOI with MTM-filtered series,
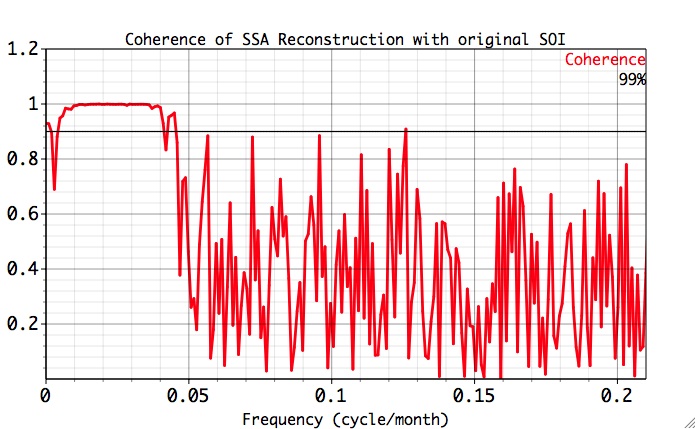
and SSA-filtered series:
As also indicated by the MTM Components table,
SSA reconstruction provides for a very high coherence in a much wider frequency band then MTM, which is mainly restricted to the frequencies used in the reconstruction. This result is an agreement with the Blackman-Tukey cross-spectrum of SSA-filtered time series and original SOI, and also demonstrates SSA use as a very effective frequency band filter.
|
|
|
|