
 |
 |
 |
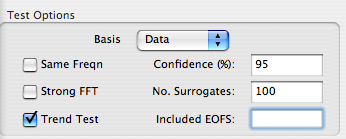
When Trend Test box in SSA Advanced options panel is checked, two tests are performed that help to identify nonlinear trending and low-frequency SSA components, up to the maximum number set in Components on the main SSA panel:
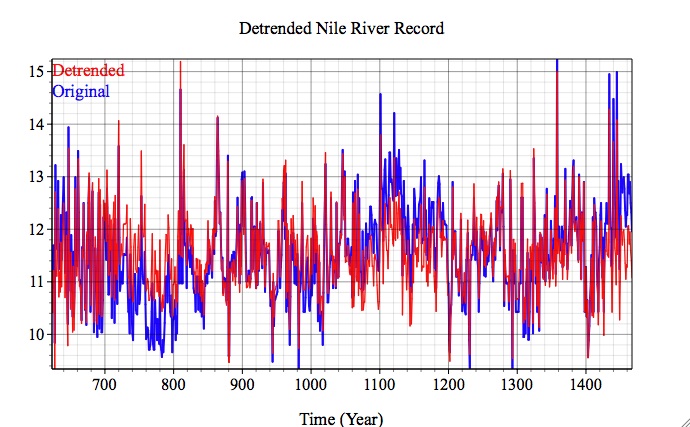
Results of these tests are available in Log after running SSA. Here we demonstrate it on the Nile river example in Examples/Hydrology folder of kSpectra.
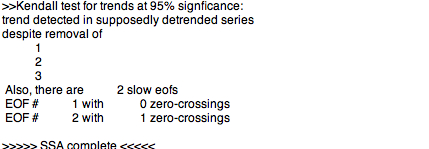
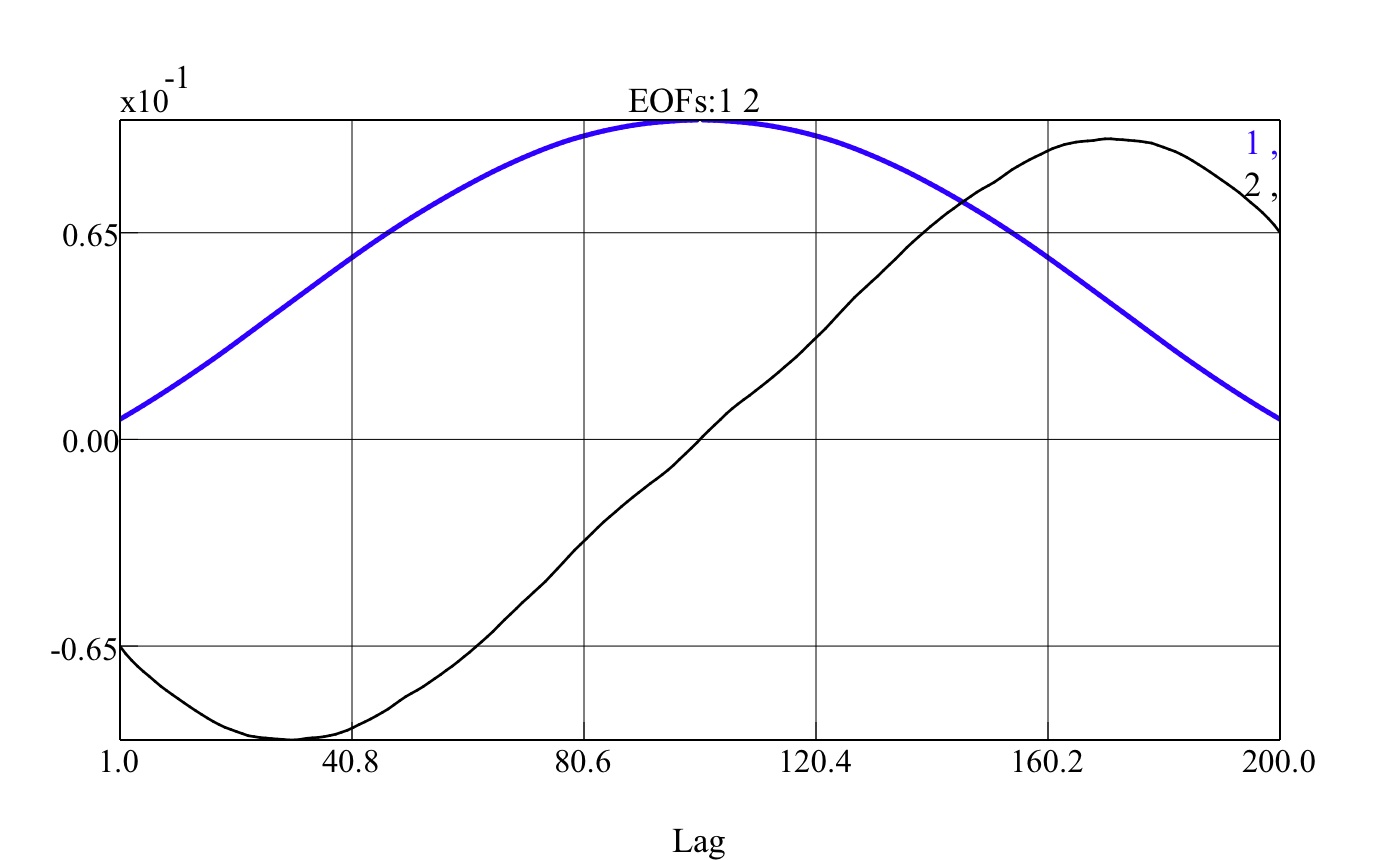
The Log shows that leading three SSA components pass Kendall trend test both in T-PCs and RCs, though detrended time series (reconstruction without these components included), still has some low-frequency contribution. Also, leading two T-EOFs are "slow", i.e. with small number of zero-crossings:
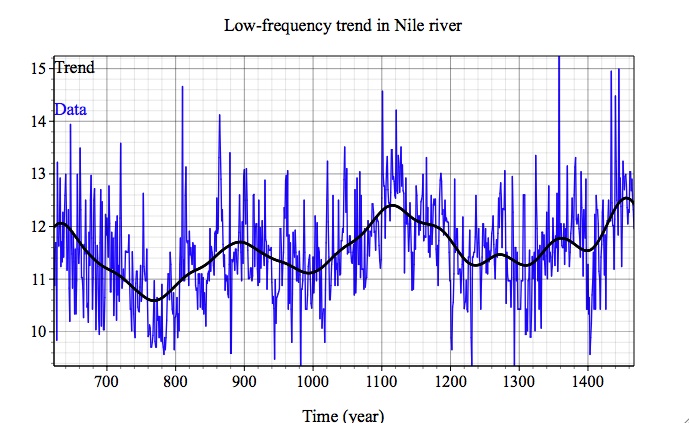
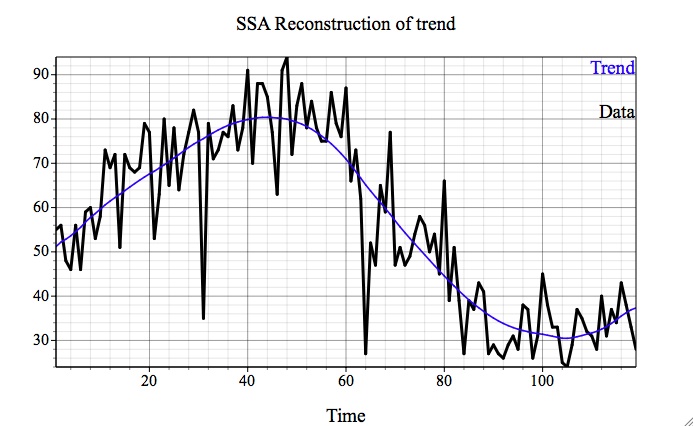
By selecting three leading rows in SSA components table, performing Reconstruction and plotting the Result, we obtain the nonlinear, low-frequency trend:
If Reconstruction is performed as above, but with the filter out box checked in the Reconstruction/Prediction options panel:
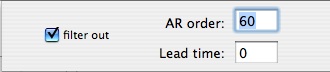
the plotted Result will be detrended time series:
One can check that if Trend Test is performed now on so-detrended time series, no SSA components are identified as trend.
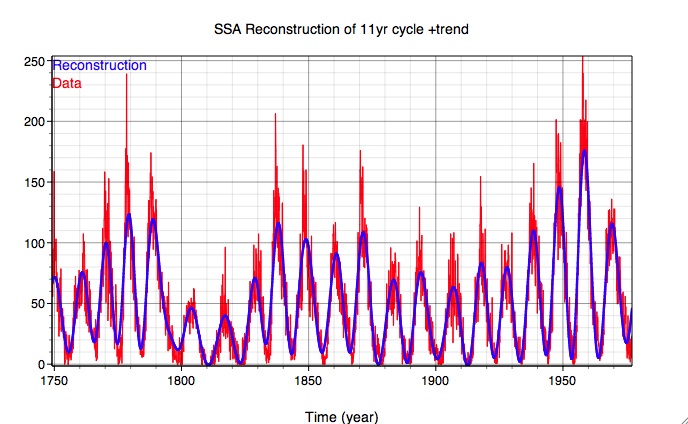
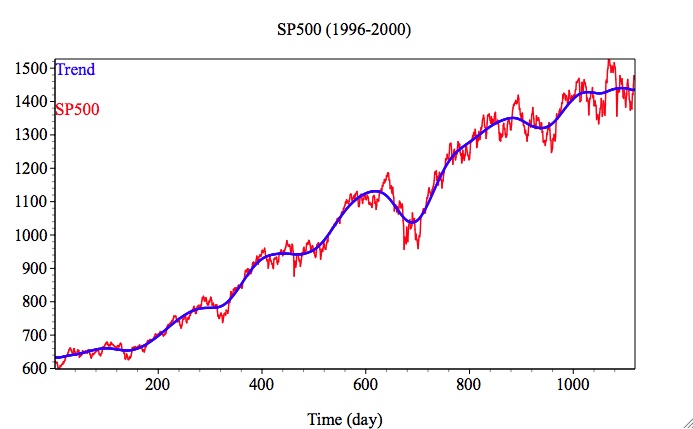
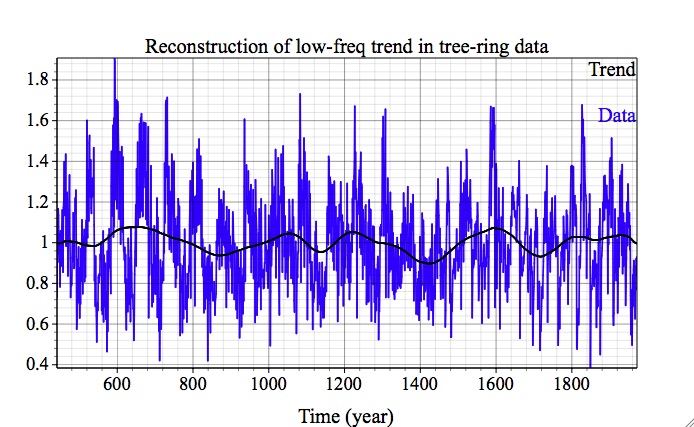
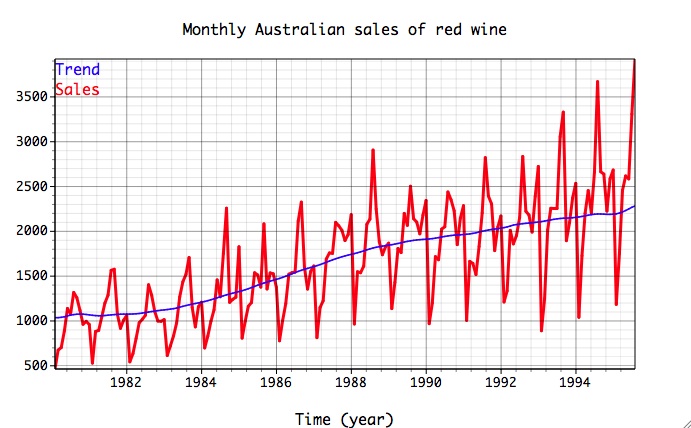
Below are more examples of SSA trend separation for Health, Finance, Paleoclimatology, Economics and Physics applications; see Examples folder in kSpectra distribution:
|
|
|
|