 |
 |
Given a stationary time series x(t), and its first M auto-correlation coefficients, the purpose of MEM is to obtain the power spectrum PX by determining the most random (i.e. with the fewest assumptions) process, with the same auto-correlation coefficients as x(t). In terms of information theory, this is the notion of maximal entropy, hence the name of the method.
The entropy h of a Gaussian process is given by

From the Wiener-Khintchin identity, the maximal entropy process and the
series x(t) will have the same power spectrum.
In practice, under the assumption that x(t) is generated by an autoregressive AR(M) process:

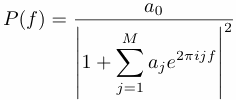
where &xi(t) is a white noise with a variance &sigma2, one can obtain estimates of coefficients aj by regression.The autocorrelation coefficients are computed first and used to form the same Toeplitz matrix as in SSA. This matrix is then inverted using standard numerical schemes to yield the estimated aj.The power spectrum P(f) of the true AR(M) process with coefficients aj is given by:

where a0=&sigma2. Therefore, the knowledge of the coefficients aj determined from the time series x(t), also yields an estimate of its power spectrum PX. In summary, the method boils down to looking for an auto-regressive process that ``mimics'' the original time series. This is why it is a called parametric method.
The MEM is very efficient for detecting frequency lines in stationary time series. However, if this time sereis is not-stationary, misleading results can occur, with little chance of being detected otherwise than by cross-checking with other techniques.
The art of using MEM resides in the appropriate choice of M, i.e. the order of regression of x(t). The behavior of the spectral estimate depends on the choice of M: it is clear that the number of its poles (or even maxima) depends on the order of regression M and the auto-regression coefficients aj , so that, for a given time series, the number of peaks will increase with M! Therefore, a trade-off between a good resolution (high M) and few spurious peaks (low M) has to be found. A few guides are provided by the default values of the toolkit (i.e. M should not exceed half the length of the time series).
The weaknesses can be remedied partly by (a) determining which peaks survive reductions in M, (b) comparing MEM spectra to those produced by Blackman Tukey correlogram and MTM which generally should not share spurious peaks with MEM, and (c) using SSA to pre-filter the series and thus to decompose the original series into several components, each of which contains only a few harmonics (so that small M values can be chosen; see Penland et al., 1991).
1. Percival, D.B., and Walden, A.T., 1993: Spectral analysis for physical applications--Multitaper and conventional univariate techniques. Cambridge University, 580 pp.
2. Penland, C., Ghil, M., and Weickmann, K., 1991: Adaptive filtering and maximum entropy spectra with application to changes in atmospheric angular momentum: J. Geophys. Res., 96, 22659-22671.