
 |
 |
 |
In this synthetic example we follow msignal.tkt project in Examples/Multivariate Small Signal folder of kSpectra Examples.
Recently, Groth and Ghil (2011) have demonstrated that a classical M-SSA analysis suffers from a degeneracy problem, namely the eigenvectors (also called empirical orthogonal functions or EOFs) do not separate well between distinct oscillations when the corresponding eigenvalues are similar in size. This problem is a shortcoming of principal component analysis in general, not just of M-SSA in particular. In order to reduce mixture effects and to improve the physical interpretation, Groth and Ghil (2011) have proposed a subsequent Varimax Rotation of the MSSA ST-EOFs. of the spatio-temporal EOFs (ST-EOFs) of the M-SSA. To avoid a loss of spectral properties (Plaut and Vautard 1994), they have introduced a slight modification of the common varimax rotation that does take the spatio-temporal structure of ST-EOFs into account.
Here we demonstrate MSSA analysis with Varimax Rotation on a low signal-to-noise multivariate dataset:
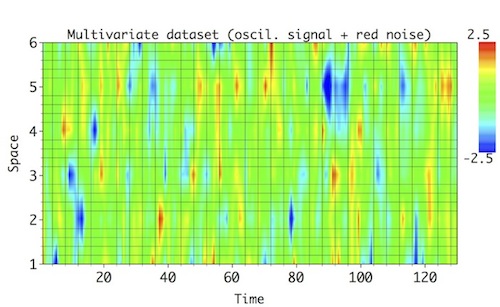
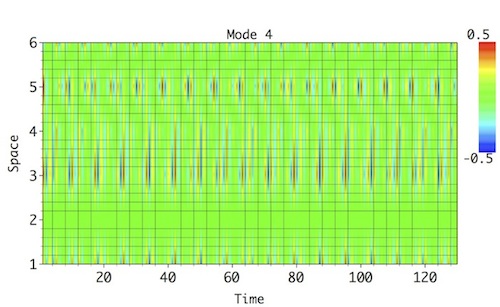
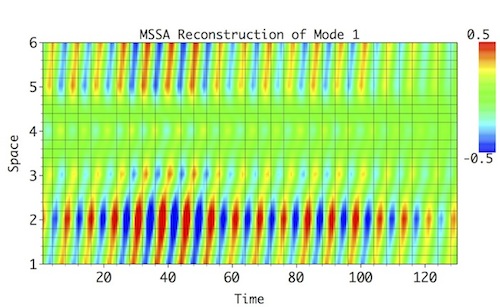
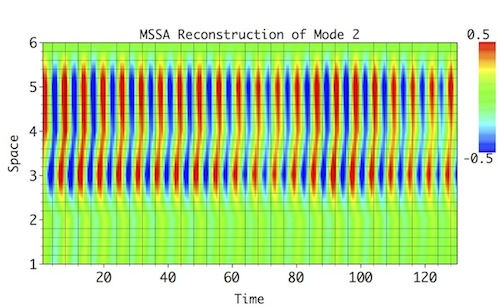
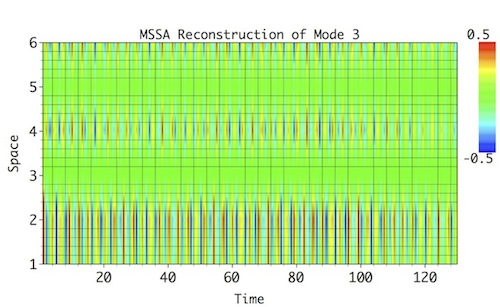
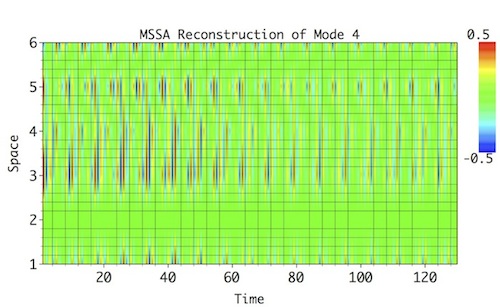
The synthetic test series consists of 6 spatial channels, eachwith a length of 130 data points; this series represents a sum of 4 distinct spatio-temporal oscillatory modes, contaminated by large-amplitude temporal red noise. These modes account for similar variance, and MSSA with Varimax Rotation helps their detection and reconstruction without mixing. Each of the oscillatory modes has a distinct frequency in time (from a low-frequency of f=0.133 to a high-frequency of f=0.435); they also have varying amplitude and phase shift across the spatial channels:
 |
 |
 |
 |
Our task will be detect and reconstruct these signal modes by using MSSA. Varimax rotation helps to isolate these modes and reconstruct in time domain without mixing
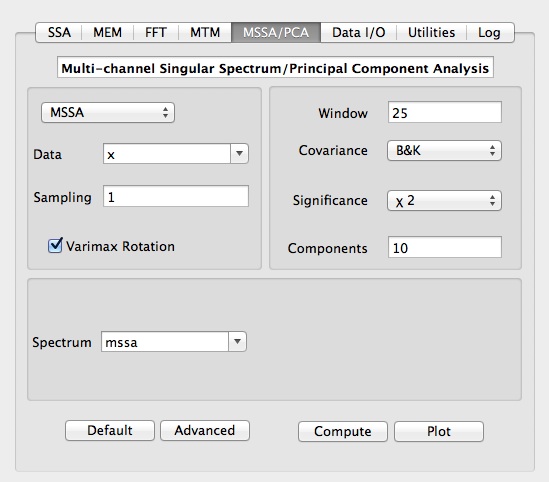
We start kSpectra, and go to Data I/O in Tools. Using Finder, we simply double-click msignal.tkt file in MSSA Prediction folder. It contains x (full data). Then we go to PCA/MSSA in Tools, select x from Data Pop-up menu, change the Window value to M=25, select 'BK' method for Covariance, MSSA tool option, Chi-squared as signfi ance test, check VarImax Rotation box and set name in Spectrum box to mssa:
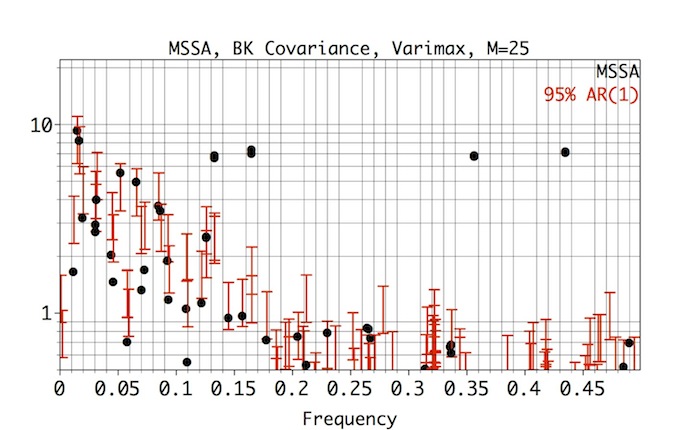
Then click Compute, followed by Plot, to obtain MSSA spectral estimate:
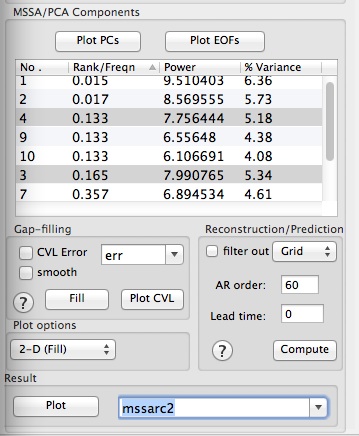
The frequencies and variances captured by each mode are displayed in a components table of Advanced options panel.
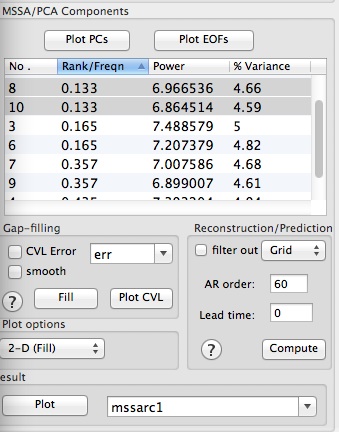
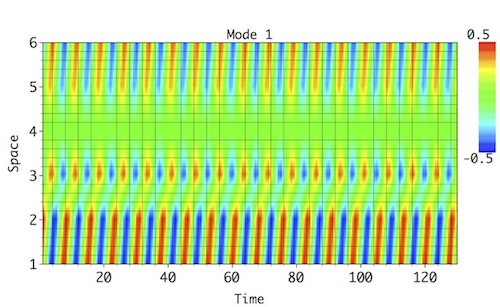
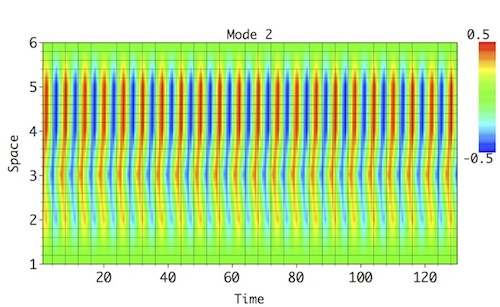
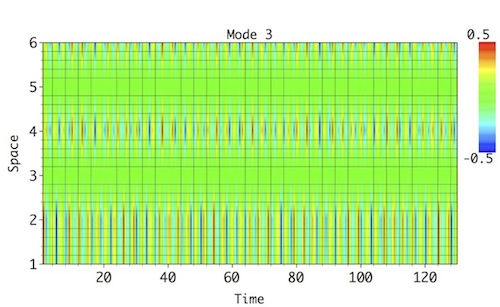
Select a pair of rows corresponding to particular oscillatory pair in MSSA components table (8 and 10 for Mode 1; 3 and 6 for Mode 2; 7 and 9 for Mode 3; 4 and 5 for Mode 4), set a name in Result section, and then click Compute. To see 2-D plot of Reconstructed mode in all channels, choose 2-D Fill Plot option as above, and click Plot in Result section to obtain Figures below. The oscillatory modes and their modulatoin, both in amplitude and phase shift between the spatial channels, is reproduced reasonably well (compare with reference modes above):
 |
 |
 |
 |
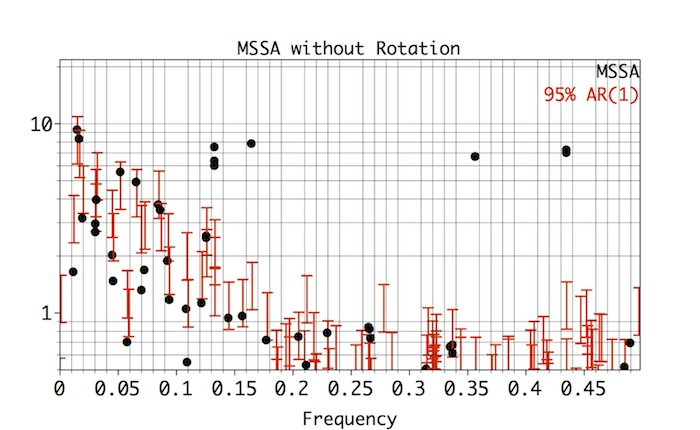
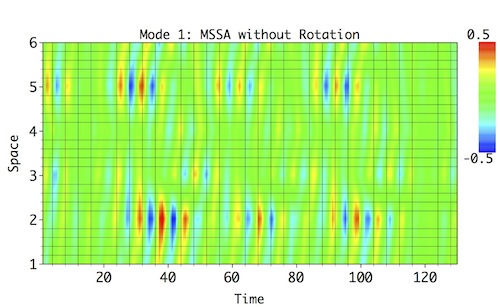
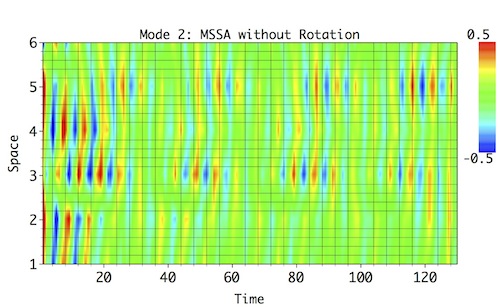
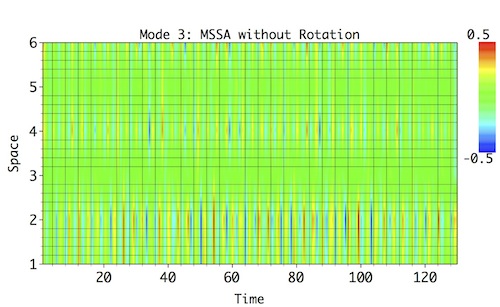
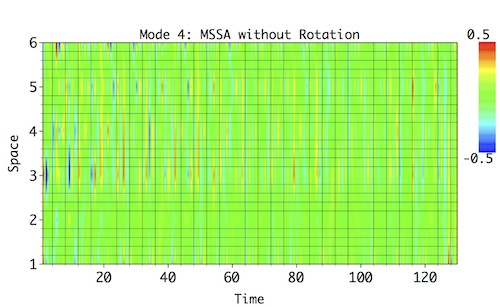
As a comparison, MSSA without Varimax rotation (repeat steps above but leave Varimax Rotation box unchecked) results in a similar looking spectrum except that ST-EOFs of low-frequency modes are now mixed (notice frequency shift of ST-MSSA mode from f=0.165 to f=0.133 resulting in a triple):
Reconstruction of the two low-frequency modes (Mode 1 and 2) invetably results in a very mixed and modulated patterns that don't resemble much reference patterns (see above), and the high-frequency modes (Modes 3 and 4) are negatively impacted as well.
 |
 |
 |
 |
|
|
|
|